WACC and EVA dynamic analysis
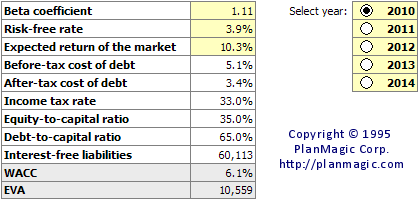
The WACC and EVA assumptions (Advanced Edition)
Enter the Beta coefficient, the Risk-free rate for you company and the Expected return of the market, the rest of the data is calculated from the 5 years projections.

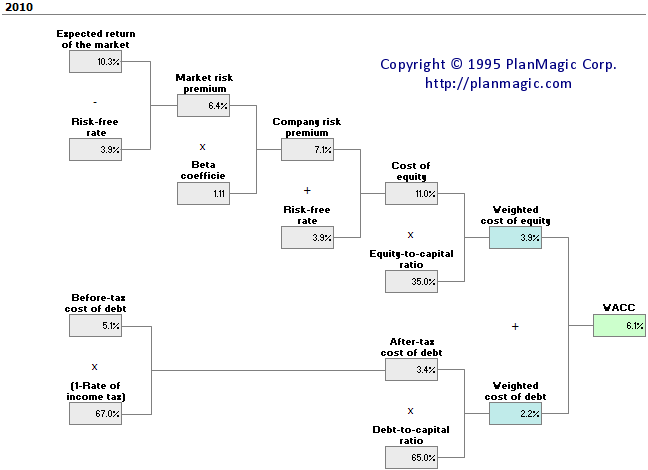
Weighted average cost of capital (WACC) analysis
You can see the formulas used in the tree that result in the WACC.

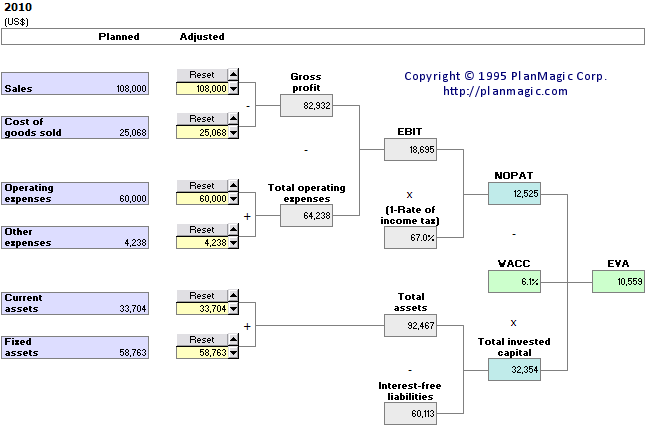
Economic added value (EVA) dynamic analysis
You can use the EVA dynamic analysis for each of the 5 years. Use the arrows to increase/decrease a value and see what the result of that variation would mean for the bottom lines of the business. Use this analysis to monitor results and to adjust your business where needed.
